VISUAL ESSAY / TRAFFIC FLOW

Fundamental Diagrams

FIELD GUIDE

When More Becomes Less

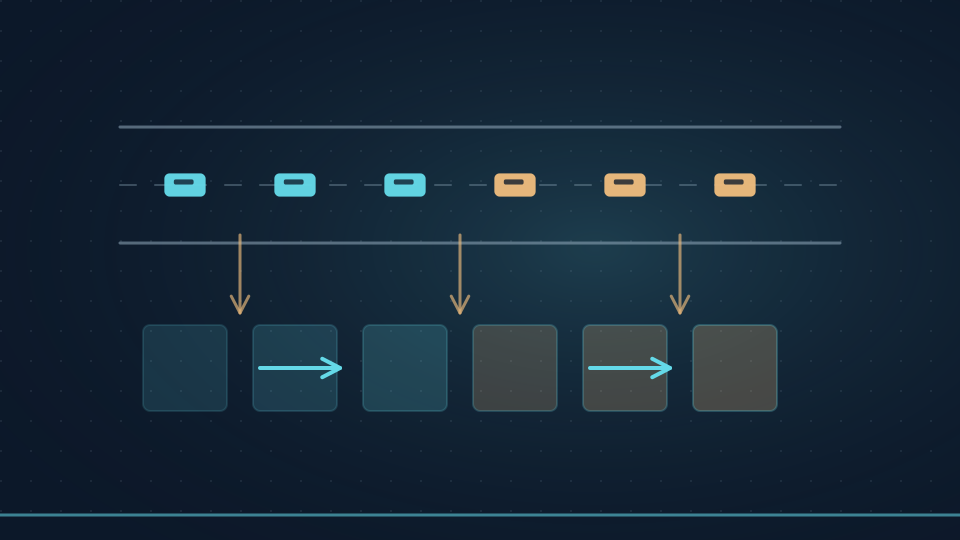
How can a road carry less traffic even as more vehicles try to use it? Fundamental diagrams describe how the number of vehicles occupying a road relates to their average speed and to the rate at which traffic moves through it. When traffic is sparse, vehicles can travel quickly, but few are present. As the road fills, it initially carries more traffic. Beyond a critical level, vehicles interfere with one another and queues develop; adding still more vehicles can slow movement enough to reduce the flow.

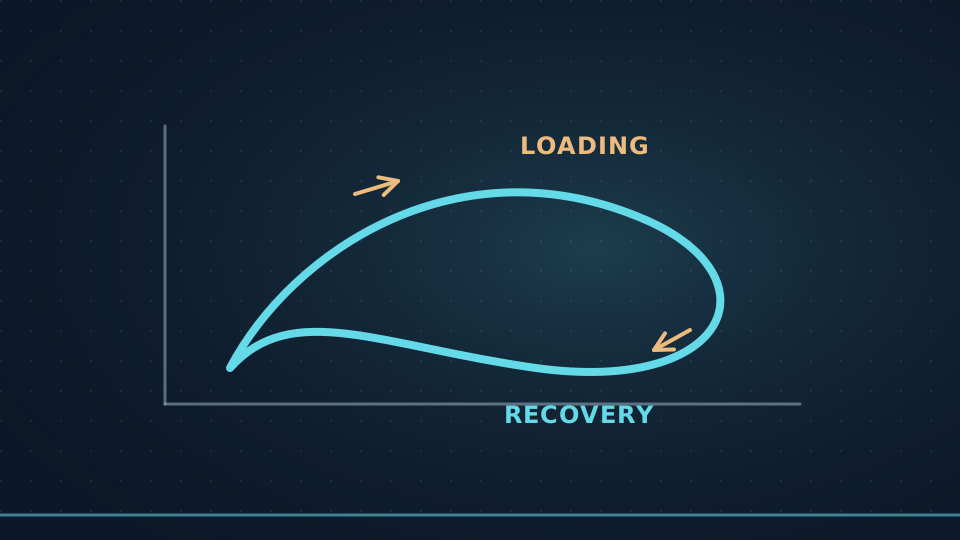
The video follows one road from nearly empty conditions into severe congestion. Its two evolving charts show average speed falling as the road fills, while flow first rises and then declines. The key insight is that road capacity has a peak: more vehicles do not always mean more movement. This distinction helps explain bottlenecks, diagnose congestion, and judge when additional demand will make a road perform worse. The curves are measured from an illustrative simulation, so their exact shapes are not universal or calibrated predictions.